Features
Below is more details about what makes HXLDash optimised for humanitarians.
Quick Mapping
HXLDash supports mapping of areas (polygons) and points
Area mapping
HXLDash is linked to the common operational data sets. If you include Pcodes for in your data set for that country and have the right HXL tag (#country+code, #adm1+code, #adm2+code, #adm3+code, #adm4+code) the dashboard will automatically download the appropriate matching geometry file, link your data to the geometry and produce a map. Please refer to list of support countries. Geometry files are taken from the UN Mapping Webservice and have been pre-processed to optimise them for web.
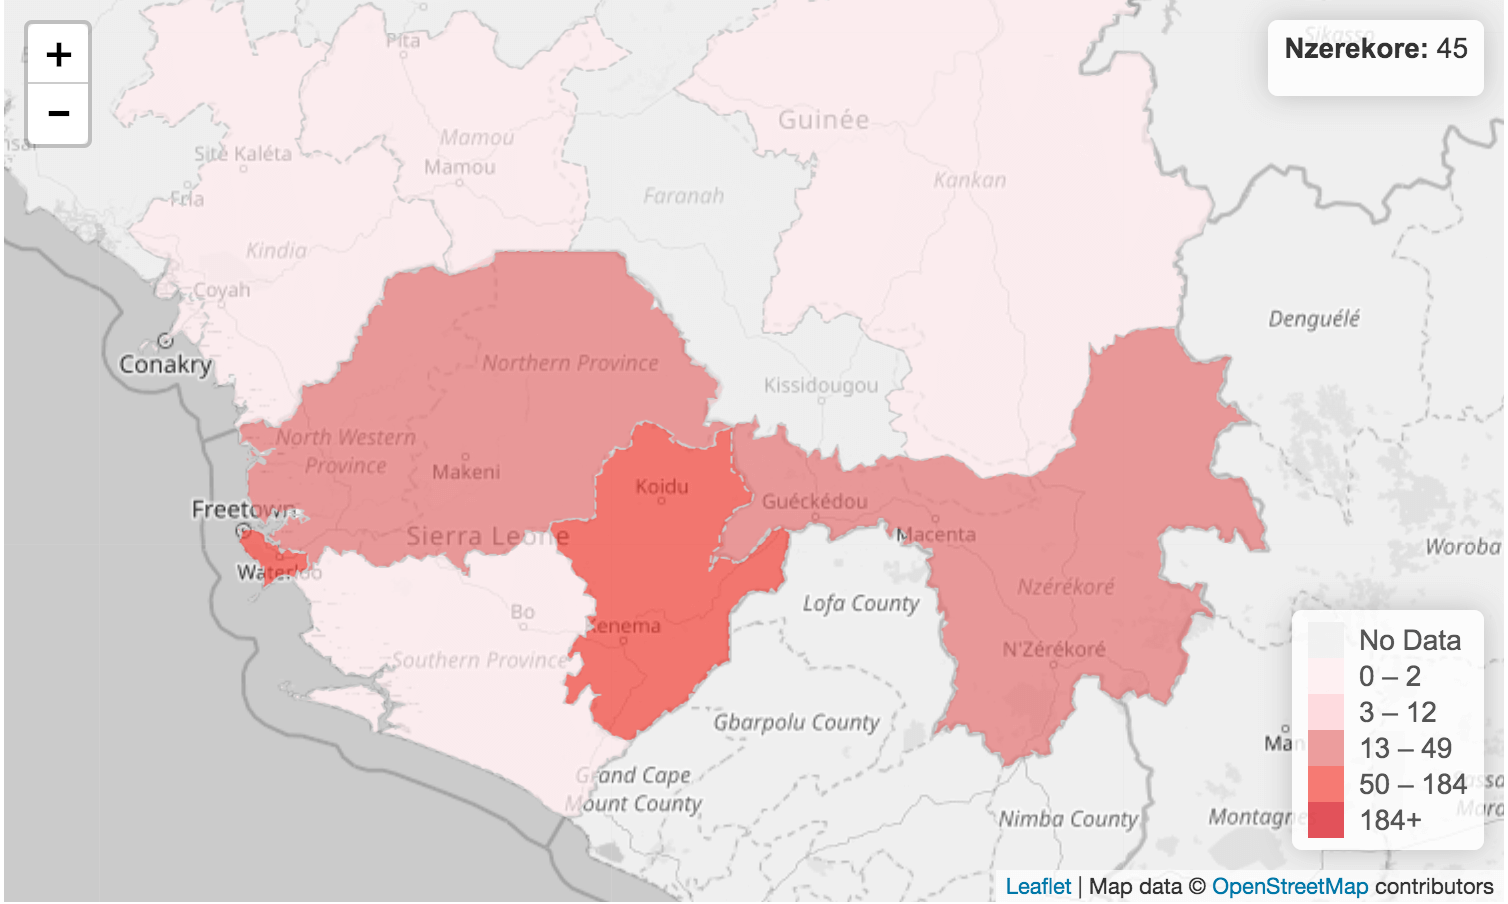
An example of a choropleth map
Point mapping
If your data set contains the tags #geo+lat, #geo+lon this will create a point map which can then be styled with data values from other columns.
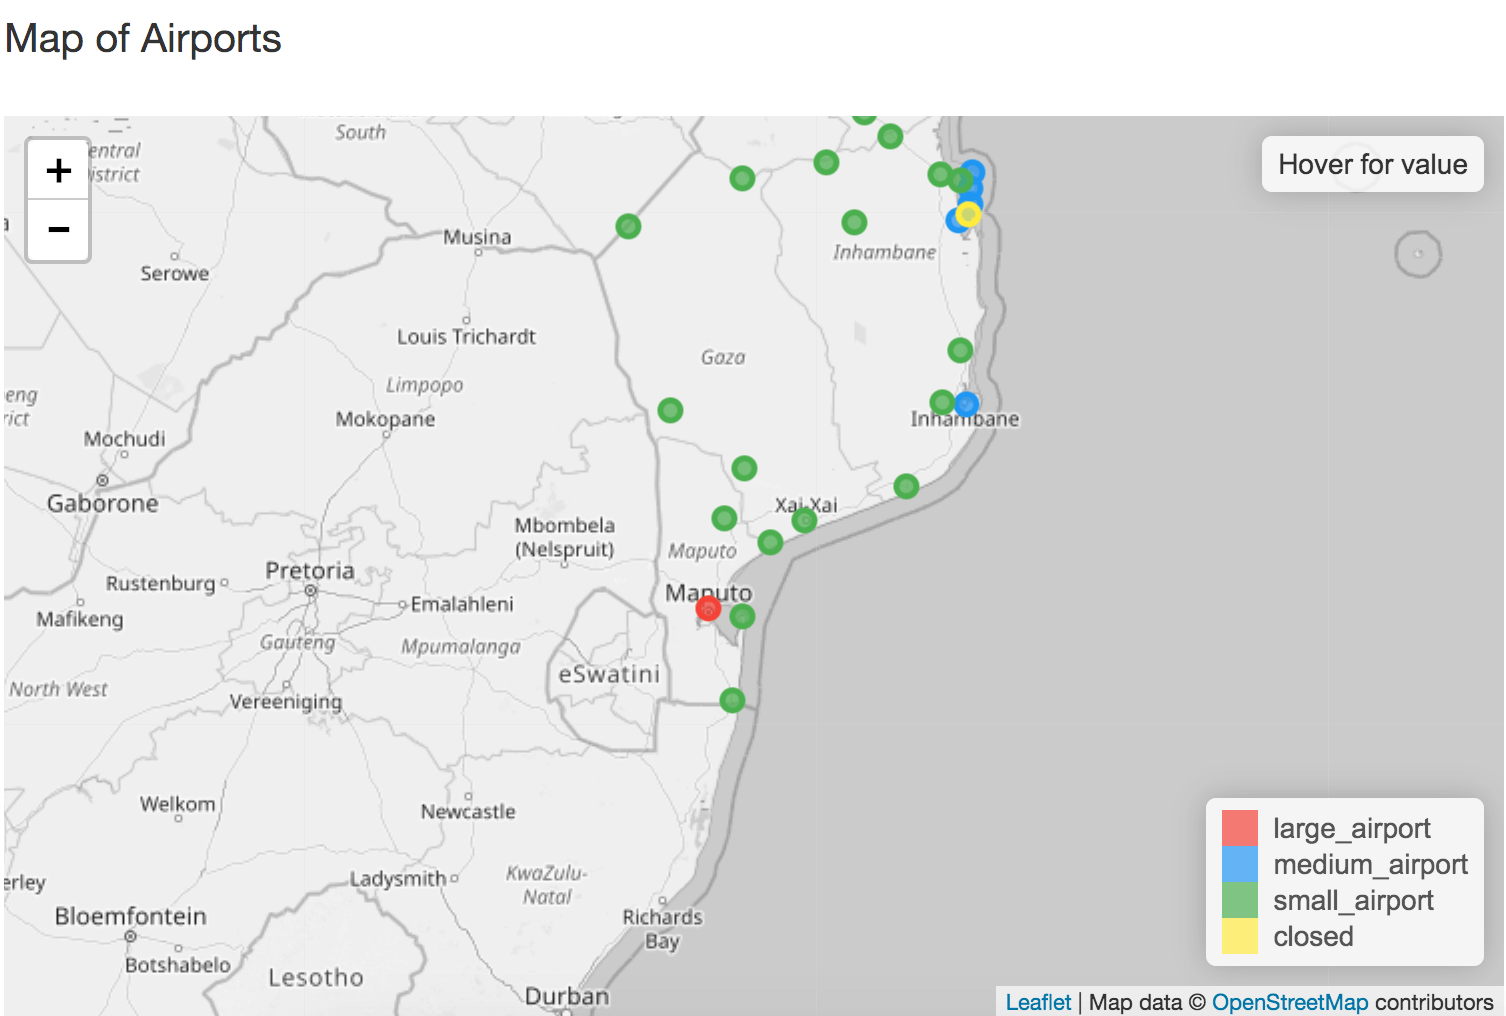
An example of a point map
Intelligent Suggestions
HXLDash uses the HXL Humanitarian Exchange Language (HXL) tags and a suggestion engine to create charts and maps that make sense for your data set. These suggestions are then used to build the dashboard in just a few clicks. The suggestions engine reduces the need to have a complex interface to build charts. We are working on improving the suggestion engine algorithm so if a chart you want does not appear. Contact us and we'll correct the situation as soon as possible.
The suggestion engine works by analysing the tags present in your dataset, comparing them against a list of pre defined recipes for charts and maps. If the tags are present then the chart or map is produced.
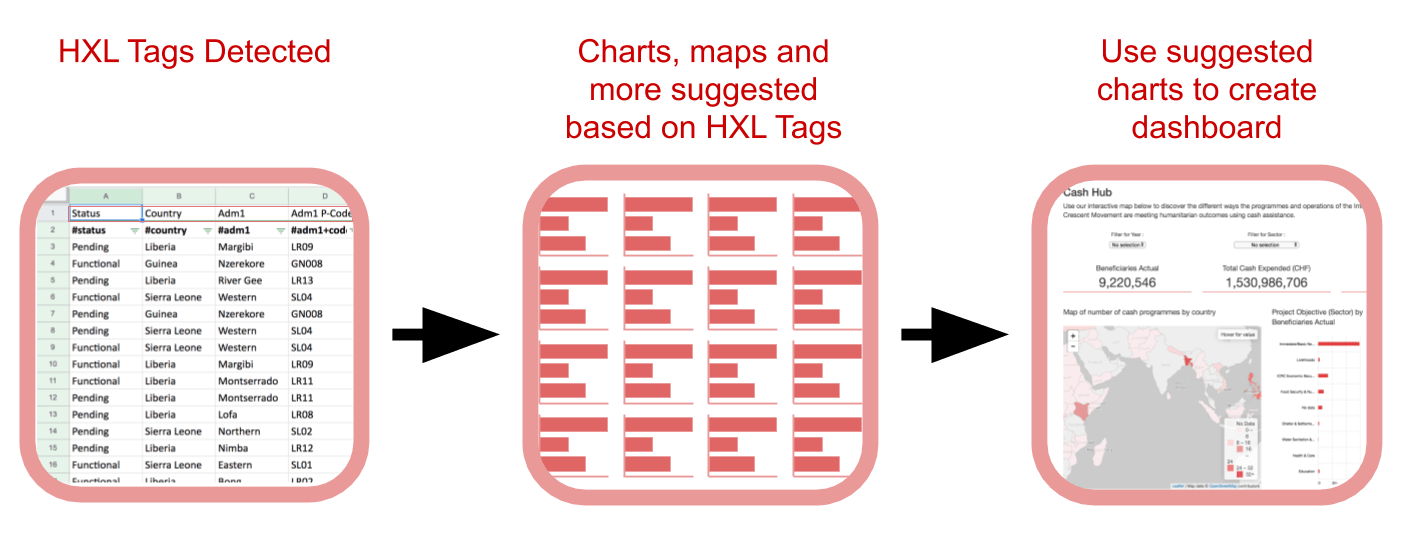
Overview of intelligent suggestions process
Print Friendly
We know that 50% of data products used in the field are on paper. HXLDash is designed to produced dashboards and maps that print easily on to an A4 piece of paper.
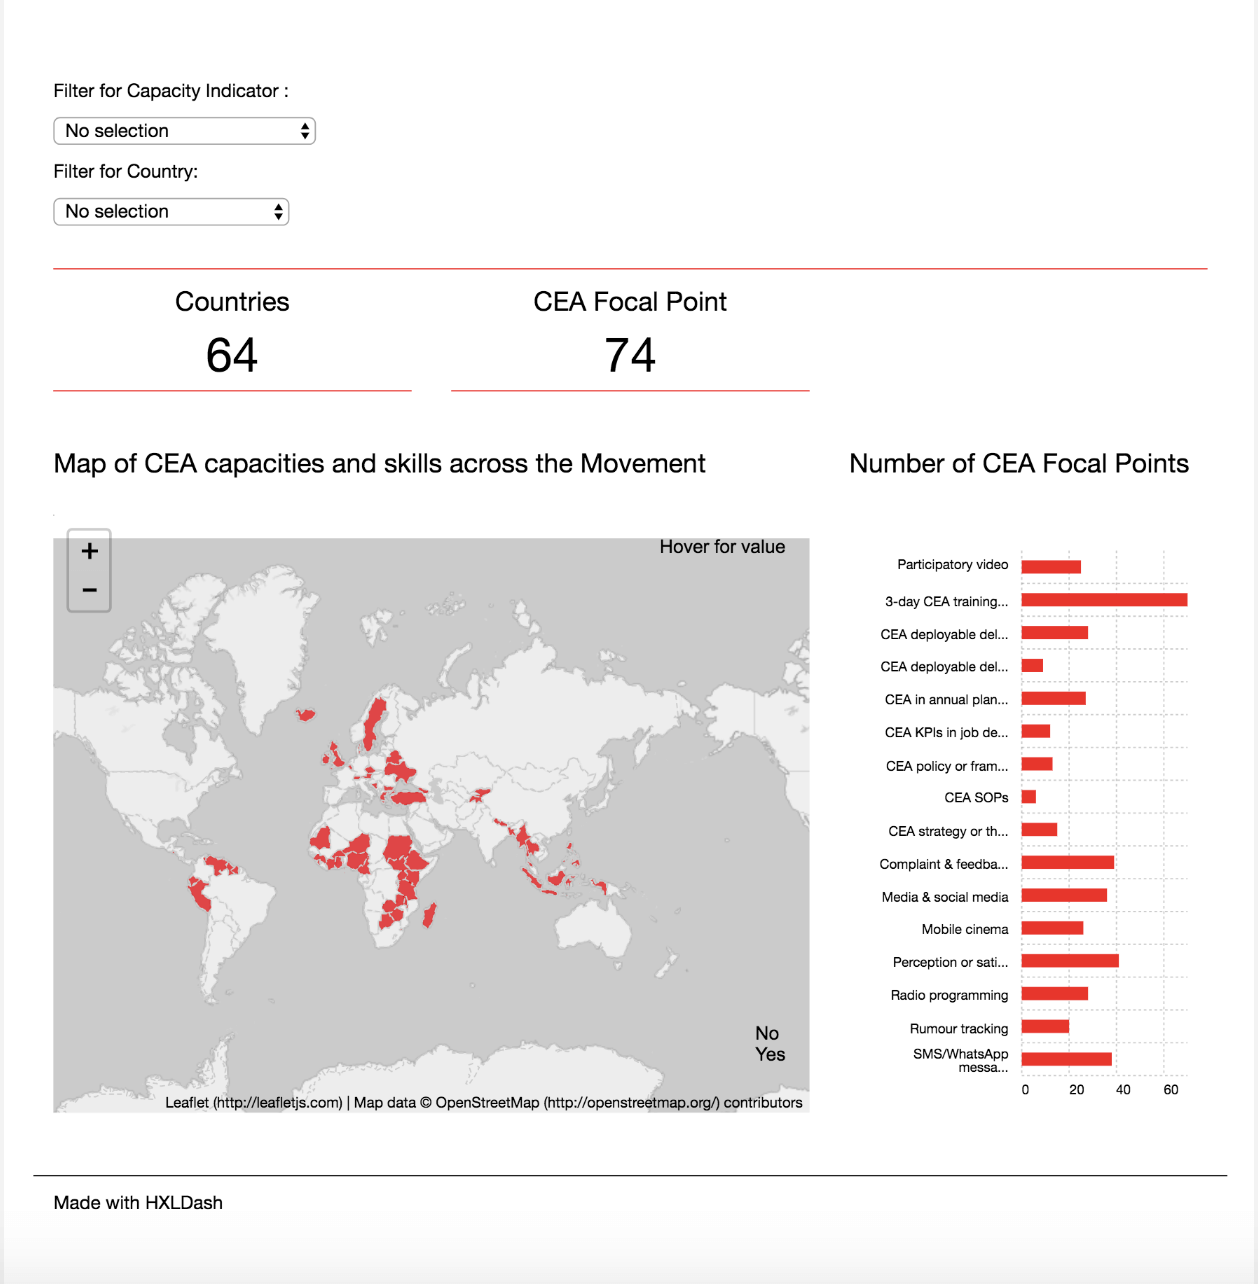
Example of print output
Low Bandwidth
Humanitarians work in many contexts where low bandwidth internet is the norm. HXLDash is built with small file sizes in mind with some dashboards coming out as 10% the file size as popular dashboard products.
Integrates with the HXL ecosystem
HXLDash can be chained with other tools in the HXL ecosystem to create powerful workflows. The HXL Proxy in particular can be used to transform and combine data before being processed by HXLDash. This means live workflows can be set up where updating the underlying data will update the visualisation.
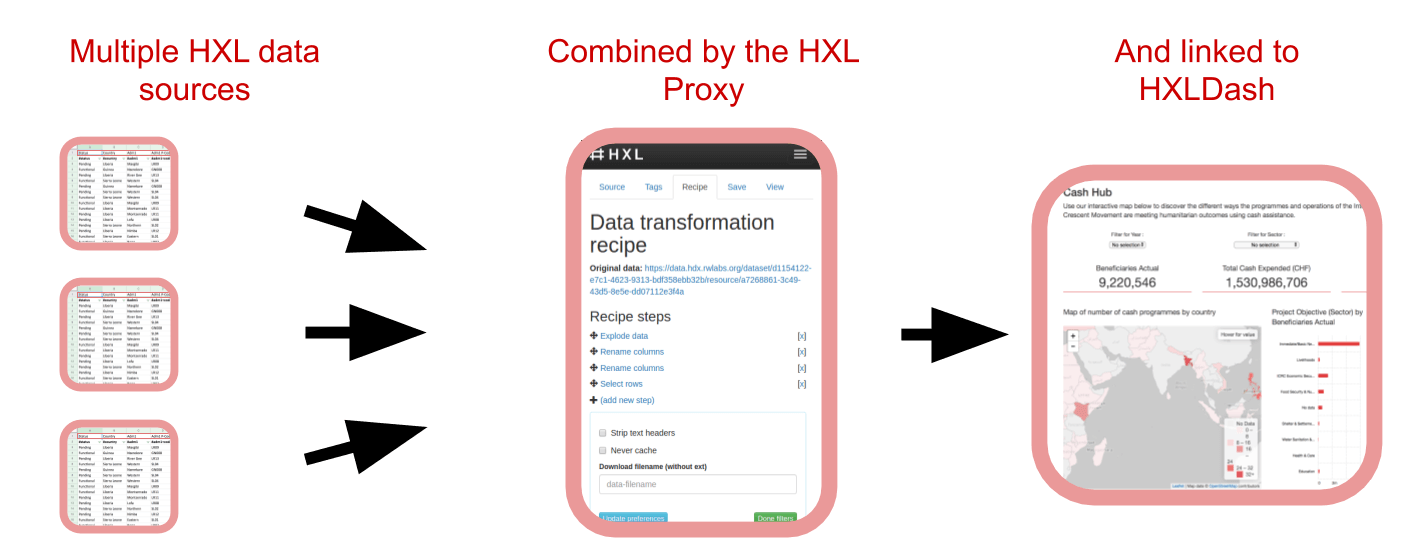
A workflow pulling data from Google Sheets, combining in the HXL Proxy and being visualised in HXL Dash.
Free and Open Source
HXLDash is free and open source under a MIT License. Please see the source code on our Github repo.